
Quantitative research results: perceptions of the past, present and future.
Life satisfaction in Ukraine is somewhat lower than global* levels, but optimism is substantially higher. Two thirds (64%) are in the “struggling” zone: their current-life rating is moderate (in line with global levels), while hopes for the future are high. The share of those who are thriving is close to the global level (29% vs. 31%), while the share of those who are suffering is lower (7% vs. 12%).
Life satisfaction
Which rung of the ladder do you feel you are on now?
Which rung of the ladder do you expect to be on in 5 years?
Sample N=1000
Full scale from 0 to 10
Life satisfaction among Ukrainians in 2026
Which rung of the ladder do you feel you are on now? Which rung of the ladder do you expect to be on in 5 years?
Satisfied and confident
A sizeable share (29%) are satisfied and confident. These are mainly people with higher incomes, those who are employed and/or have families — married people feel more satisfied with their lives today. They are more focused on the future and tend to plan ahead.
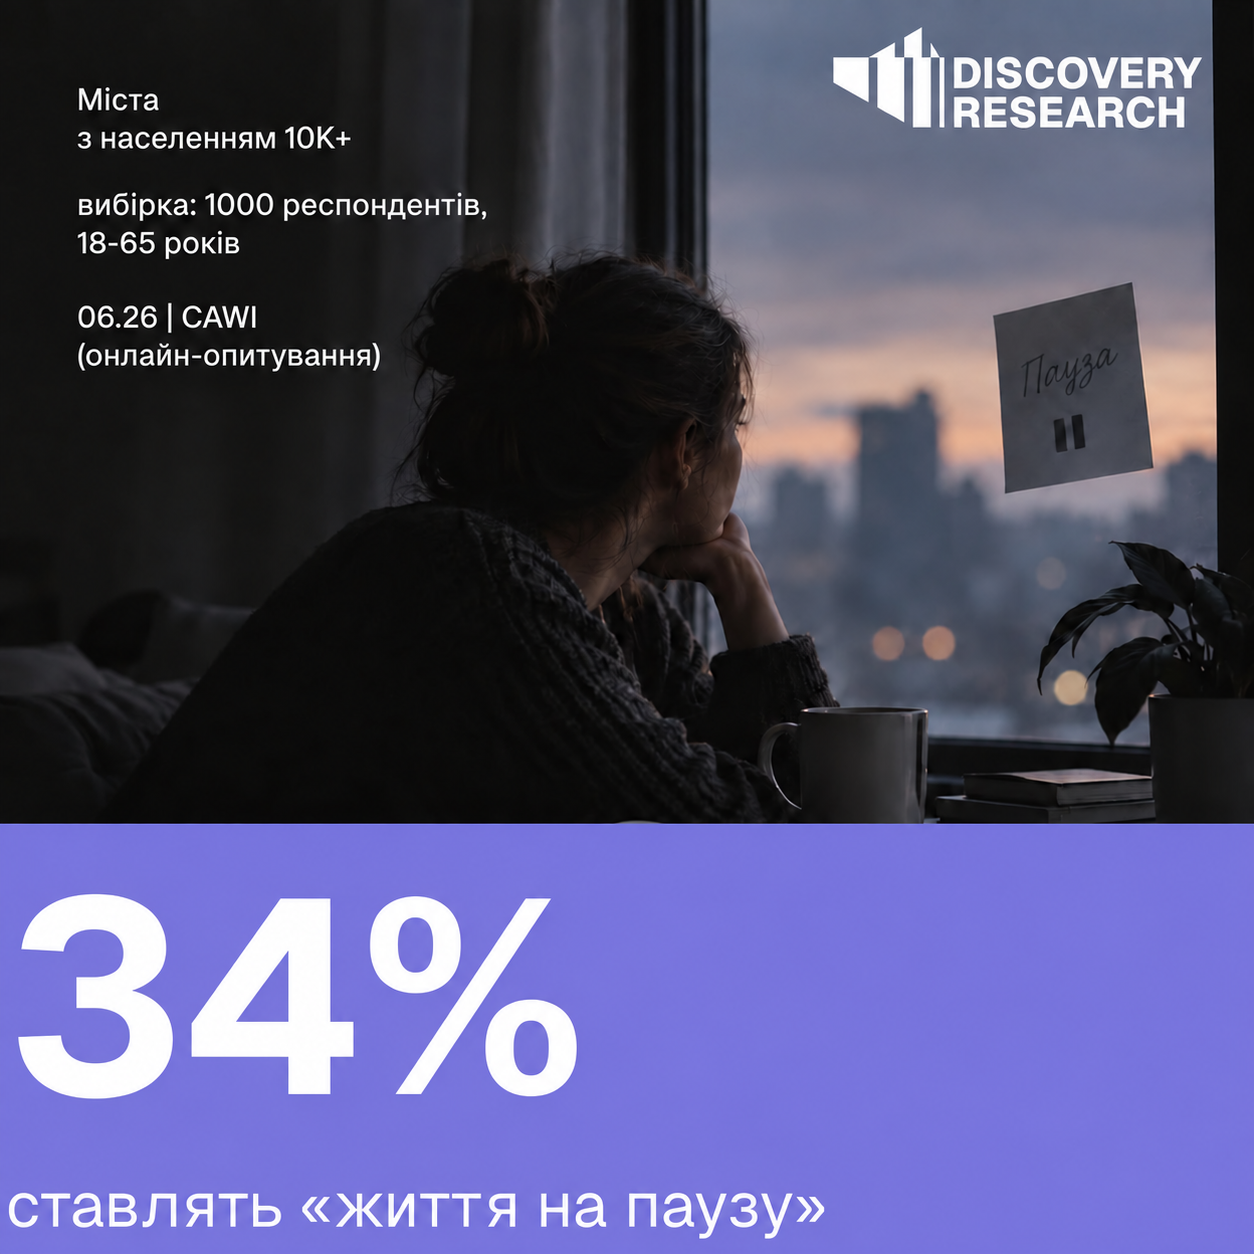
Life on hold
34% of respondents feel that life is difficult now but believe it will improve significantly in the future. This is more common among people aged 30–49 (the most burdened age group) and women with children aged 3–18 (mothers of children under 3 are slightly more satisfied). They are often unemployed or on parental leave. They want to get the most out of life but do not allow themselves to do so.
Cautious optimists
Moderate optimism is shown by 26%. No significant socio-demographic differences were identified, but they think about leaving the country more often. They are more traumatised and often focus on their painful past.
Expect things to get worse
5% expect things to get worse. These are people who feel relatively well now but believe the future will be worse. This outlook is more common among men, especially those of conscription age who restrict their movement outside the home (do not leave home). It is also more common among divorced respondents.
Disillusioned
7% are disillusioned. Men also predominate in this group, especially those of conscription age who restrict their movement outside the home. Low income adds to the pressure. This group is more common in large cities (500,000+). It is also the group most likely to express a desire to migrate abroad. They are more traumatised and often focus on their painful past.
The disillusioned focus on the past, the confident on the future
ATTITUDES TOWARD THE PAST, PRESENT AND FUTURE
Read each statement. Rate how well it describes you.
Sample N=1000, ages 18–65
| Scale | Statement | Mean score from 1 to 5 |
|---|---|---|
| Future | 3.55 | |
| I complete tasks by making a plan of action in advance | 3.39 | |
| I meet established deadlines for completing work | 3.86 | |
| I believe it is worthwhile to plan the next day every day | 3.39 | |
| Fatalistic present | 3.27 | |
| Fate controls most of my life | 3.13 | |
| There is little that can be done about what is inevitable | 3.37 | |
| If something is meant to happen, it will happen no matter how hard I try to change it | 3.30 | |
| Hedonistic present | 3.19 | |
| Taking risks makes my life more interesting | 2.89 | |
| I do what I want now without thinking much about the consequences | 2.79 | |
| I want to get the maximum enjoyment out of life | 3.88 | |
| Negative past | 3.24 | |
| I often think about what I should have done differently in life | 3.40 | |
| Painful events from the past keep coming back to my mind | 3.28 | |
| I often think about bad things that happened to me in the past | 3.05 | |
| Positive past | 3.63 | |
| I enjoy remembering the good old days | 3.73 | |
| I find it pleasant to think about my past | 3.27 | |
| Family traditions are important to me | 3.89 |
ATTITUDES TOWARD THE PAST, PRESENT AND FUTURE
Read each statement. Rate how well it describes you.
Sample N=1000, ages 18–65
Future
3.55Fatalistic present
3.27Hedonistic present
3.19Negative past
3.24Positive past
3.63Respondents draw on positive memories and family images while maintaining a future orientation.
The present is experienced cautiously: the desire to enjoy life is high, while the willingness to take risks for it is low.
Future orientation relies more on meeting deadlines than on planning.
The disillusioned and cautious optimists are in the risk zone
Mean ZTPI scale indices across ladder segments and selected groups. Sample N=1000, ages 18–65
The disillusioned and cautious optimists are in the risk zone: painful past and fatalism are stronger among them than on average. The disillusioned are deepest in this zone.
The satisfied and confident are the only group in the balanced zone: they view the past most warmly and feel the greatest control over the future.
Those with “Life on hold” and those who expect things to get worse feel control over the future, but recall the past warmly less often than average.
People with low incomes, those who are not employed, and men who do not leave home are also in the risk zone; managers are positioned highest.
Horizontal axis: positive past minus negative past. Vertical axis: future minus fatalistic present. Lines pass through the sample mean. * Base below 50.
UKRAINE IS LIVING IN A “THINGS ARE HARD, BUT THEY WILL GET BETTER” MODE.
A large reserve of optimism is a feature of wartime. It is a resource for society, but also a risk: when expectations are deferred to the future, failure to realise them may turn into disappointment.
SATISFACTION WITH THE PRESENT IS DETERMINED BY RESOURCES. Income and employment most strongly separate people between the “Satisfied and confident” and “Disillusioned” groups: low income is directly associated with disillusionment, while belief in the future depends less on income. RESOURCES ALSO SUPPORT FUTURE ORIENTATION: employment, education, a managerial position and marriage (being in a family relationship also has an effect).
MARITAL STATUS AFFECTS LIFE SATISFACTION. Married respondents are more likely to feel satisfied already today, while unmarried respondents assess their future just as optimistically as married respondents. Divorced respondents, however, rate both the present and the future lower: they have the smallest share of satisfied people and twice as many who expect things to get worse. Married respondents are also more likely to plan the next day.
GENDER DIFFERENCE IN VIEWS OF THE FUTURE. Women are more likely to expect improvement and less likely to expect things to get worse. At the same time, their view of the present is often fatalistic: what is meant to happen will happen. Men are somewhat more pessimistic, especially those whose lives are restricted because they are of conscription age. Men are also more likely to “hold on” to memories of the past and recall the “good old days.”
OPTIMISM WEAKENS WITH AGE. The older the respondent, the lower their expectations for the future and the smaller their reserve of optimism. Young people are also more hedonistic and try not to postpone life until tomorrow, seeking enjoyment here and now.
A SIZEABLE SHARE OF RESPONDENTS PUT THEIR “LIFE ON HOLD” (34%)
Demographically, they resemble the average Ukrainian, but the group includes more people aged 30–49, mothers of children aged 3–18, and those on parental leave or without work. They perceive this stage of life as temporary. For brands, this is a large audience that postpones what it wants “until later” and may relate to the theme of “living now, without waiting for better times.”
People prone to “freezing” restrict their purchases the most (even more than the disillusioned). On average, they cut spending in 8.2 categories versus 6.3 among the satisfied and 7.8 among the disillusioned. They cut precisely the pleasures they postpone: entertainment (63% vs. 43% among the satisfied), travel (54% vs. 38%), major appliances (46% vs. 31%), and gadgets (41% vs. 29%). In January 2026, Discovery Research examined the impact of emotions on the product basket in more detail; the report is available here: https://discovery-research.com.ua/reports/report_emtion2026/
Alcohol as a way of coping among those who put their lives on hold. Over the past year, 21% in the “Life on hold” group started drinking more, compared with 12% among the satisfied. Among those who drink more, the main reasons are: to relax after a hard day (59%), to escape problems (46%), insomnia (28%), and loneliness (20%).
“CAUTIOUS OPTIMISTS” (26%) — A RISK GROUP.
They have lower levels of education, are more likely to have lower incomes, expect only limited improvement, and think more often about leaving Ukraine. If conditions worsen, this group may move into the “Disillusioned” segment.
THE DESIRE TO LEAVE THE COUNTRY IS LINKED TO A LACK OF PROSPECTS.
Migration intentions are more common among those who do not see substantial improvement ahead in Ukraine.
HIDDEN MOST VULNERABLE GROUP: MEN OF CONSCRIPTION AGE WHO PRACTICALLY DO NOT LEAVE HOME.
They make up 9% of the sample, and restrictions on movement affect both their present and their view of the future.
FATALISM MAY BE LINKED TO A LACK OF CONTROL OVER CIRCUMSTANCES. It is more characteristic of people with low incomes, women, mothers of children aged 3–18, and residents of the East.
FOCUS ON THE NEGATIVE PAST IS REINFORCED BY MATERIAL HARDSHIP AND FORCED ISOLATION: it is highest among people with low incomes (3.56) and men who do not leave home (3.47).
THOSE WHO PLAN ARE MORE CONFIDENT ABOUT THEIR FUTURE. People who do not plan for the near future are more likely to be disillusioned.
PLANNING HORIZON AFFECTS PRODUCT CHOICE NO LESS THAN INCOME.
PRICE SENSITIVITY IS DETERMINED NOT ONLY BY FINANCIAL MEANS, BUT ALSO BY HOW FAR AHEAD A PERSON PLANS THEIR LIFE
Consumers who do not see prospects for themselves are more likely to choose the cheapest brands (3.39 vs. 2.81 among those satisfied with life) and are more willing to sacrifice quality for price (3.37 vs. 3.03).
Consumers who are satisfied with life and confident in the future think in terms of long-term value: they are willing to pay more for quality products that will pay off over time (3.85 vs. 2.89) and prefer earning more to cutting expenses (3.52 vs. 2.33).
The difference persists even among people with the same income level.
PATRIOTIC CONSUMPTION WORKS FOR THOSE WHO HAVE HOPE.
Willingness to pay more for Ukrainian products, consciously choosing brands that support the Armed Forces of Ukraine, and the importance of a company remaining in Ukraine are noticeably higher among the satisfied and substantially lower among the disillusioned. Patriotic arguments have little effect on an audience that has lost hope.
“RESILIENCE” IN ADVERTISING ALIENATES THOSE WHO ARE STRUGGLING MOST.
Among all advertising themes, “resilience” is liked less than other themes on average, and among the disillusioned its rating falls into negative territory (2.60 out of 5, with 3 being neutral). The satisfied respond positively to it (3.48). A message intended to be supportive irritates people in crisis.
Sample: 1,000 men and women aged 18–65 living in Ukraine, excluding occupied territories, in cities with populations of 10,000 or more. Data collection method — CAWI; fieldwork period — 8–25 June 2026; average interview duration — 40 minutes.