
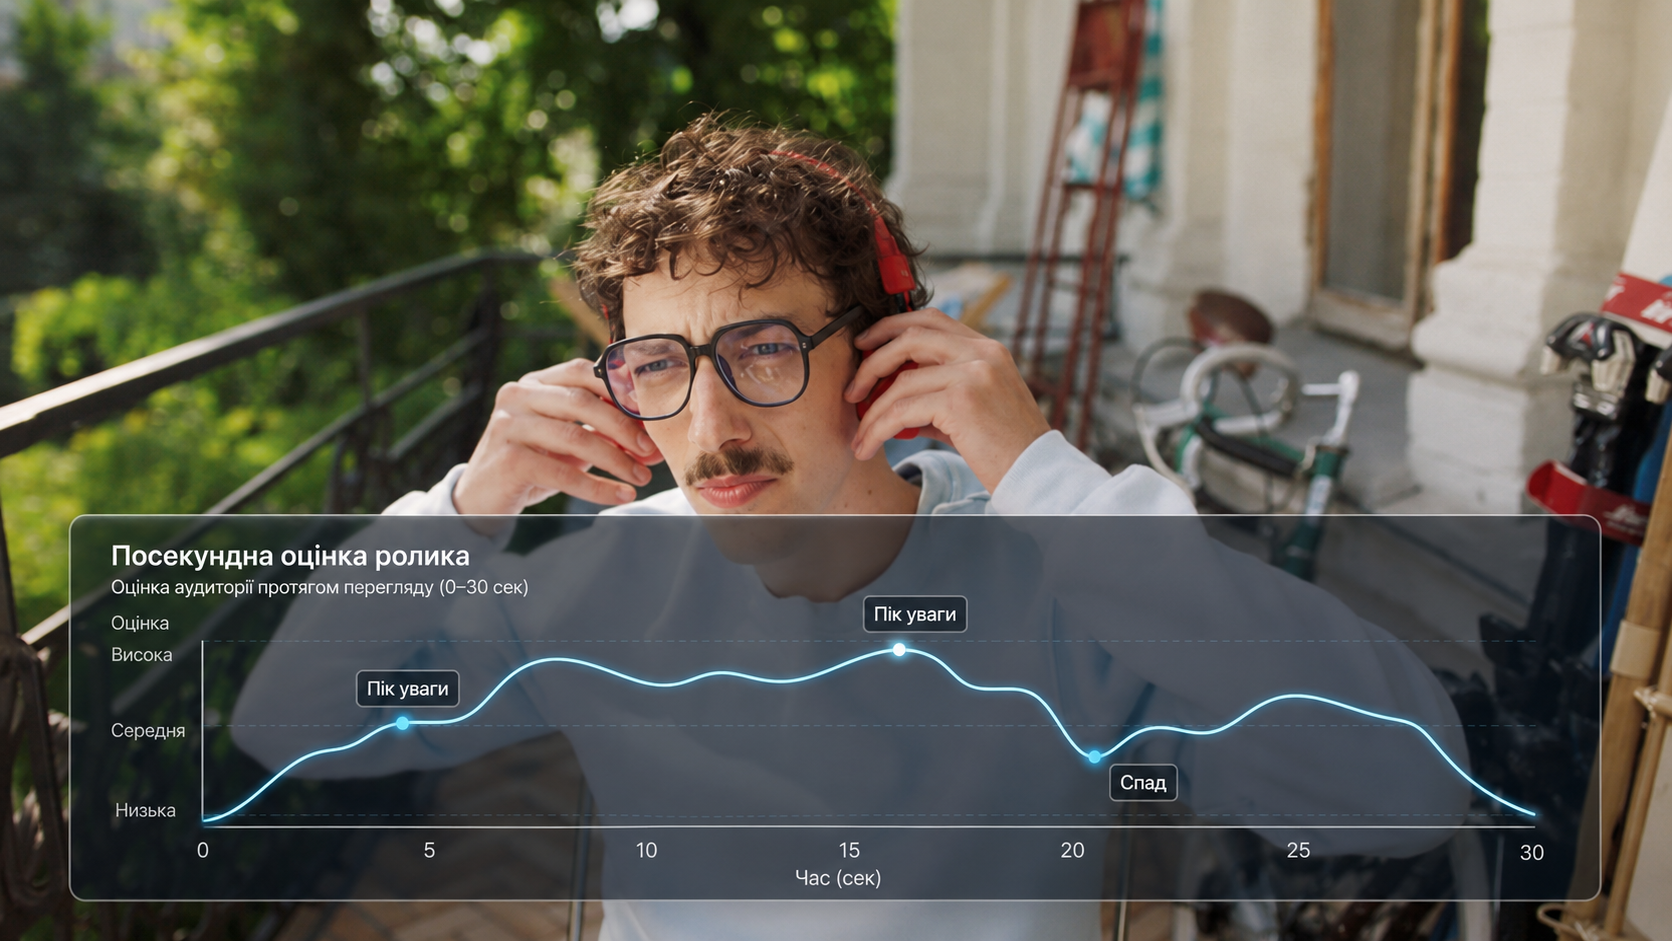
Pre-testing an advertising video before launch
Ad pre-testing is a study of the target audience’s reaction before the video is placed in the media. AdNavigator evaluates cut-through, branding, engagement, clarity of the message, memorability and purchase motivation, and it points to the specific fragments of video and text that are worth reworking.
Which business decisions ad pre-testing closes
AdNavigator does not hand out a “good or bad” verdict. It shows exactly where the video loses the viewer and what to do about it before the money goes into media.
Ten diagnostic modules
Each module answers a separate question and has its own norms for comparison. In the final report they are brought together into a single logic: from “will they notice it” to “will they buy”.
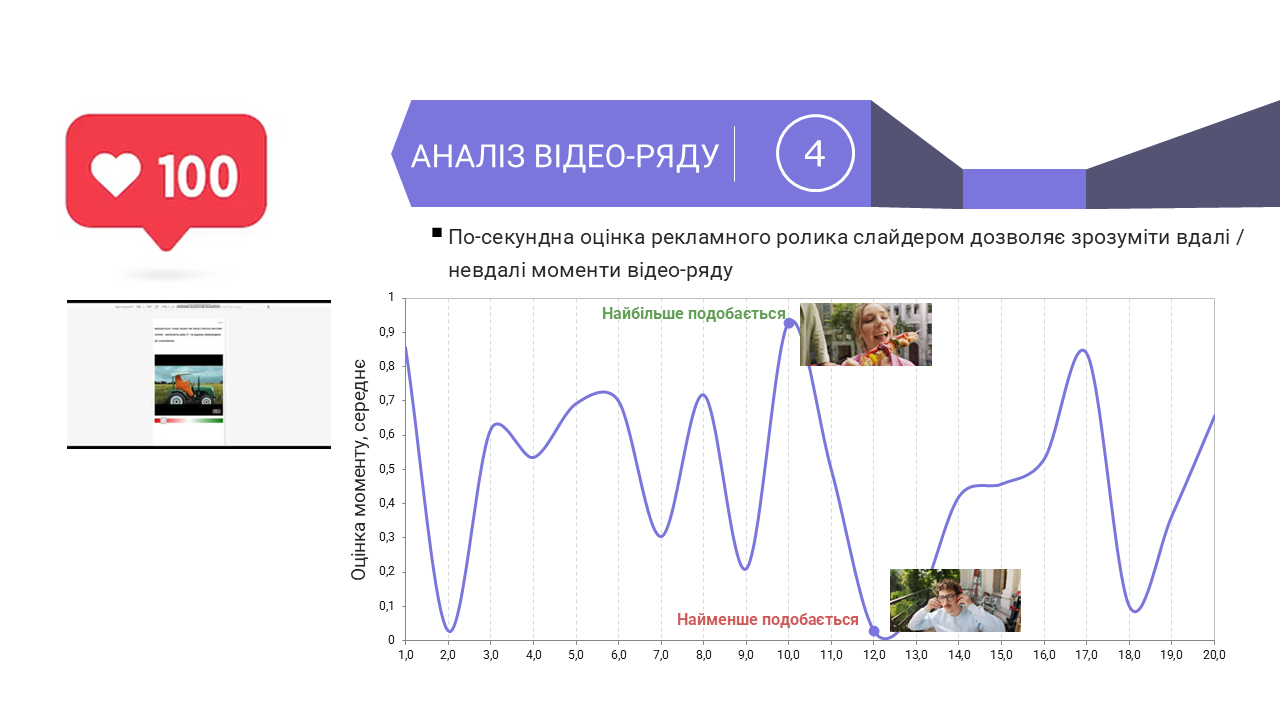
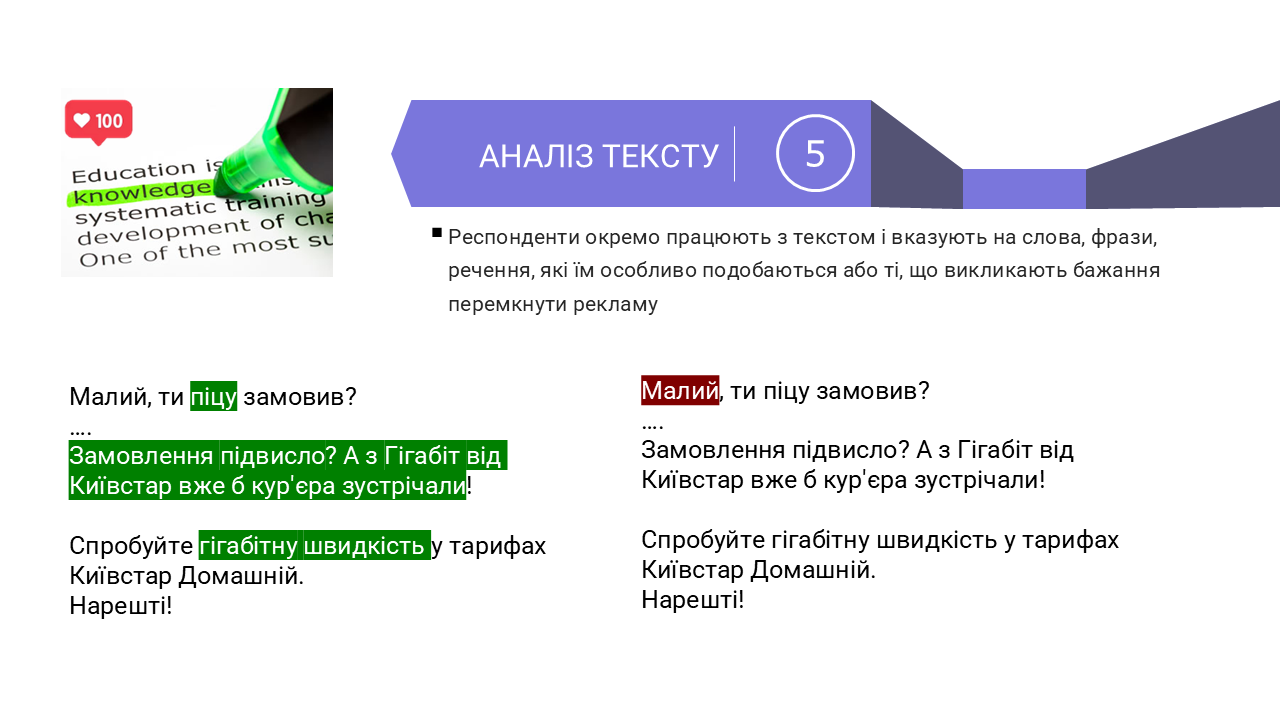
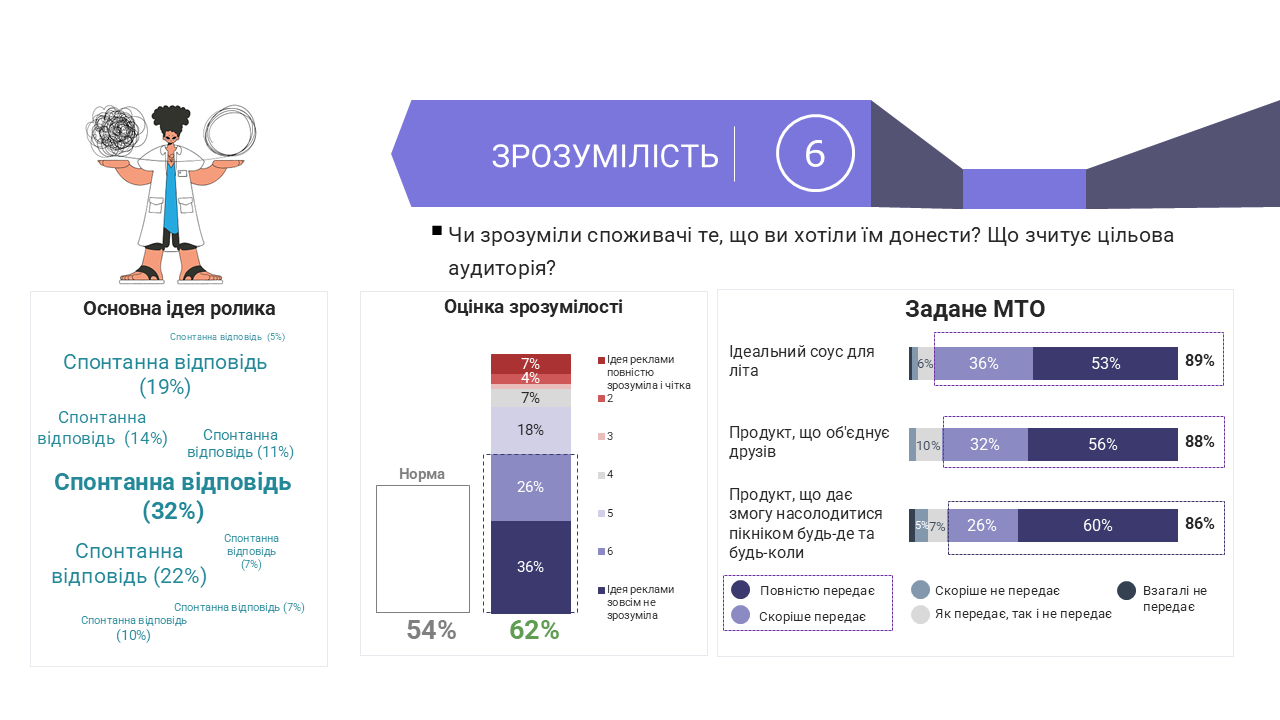
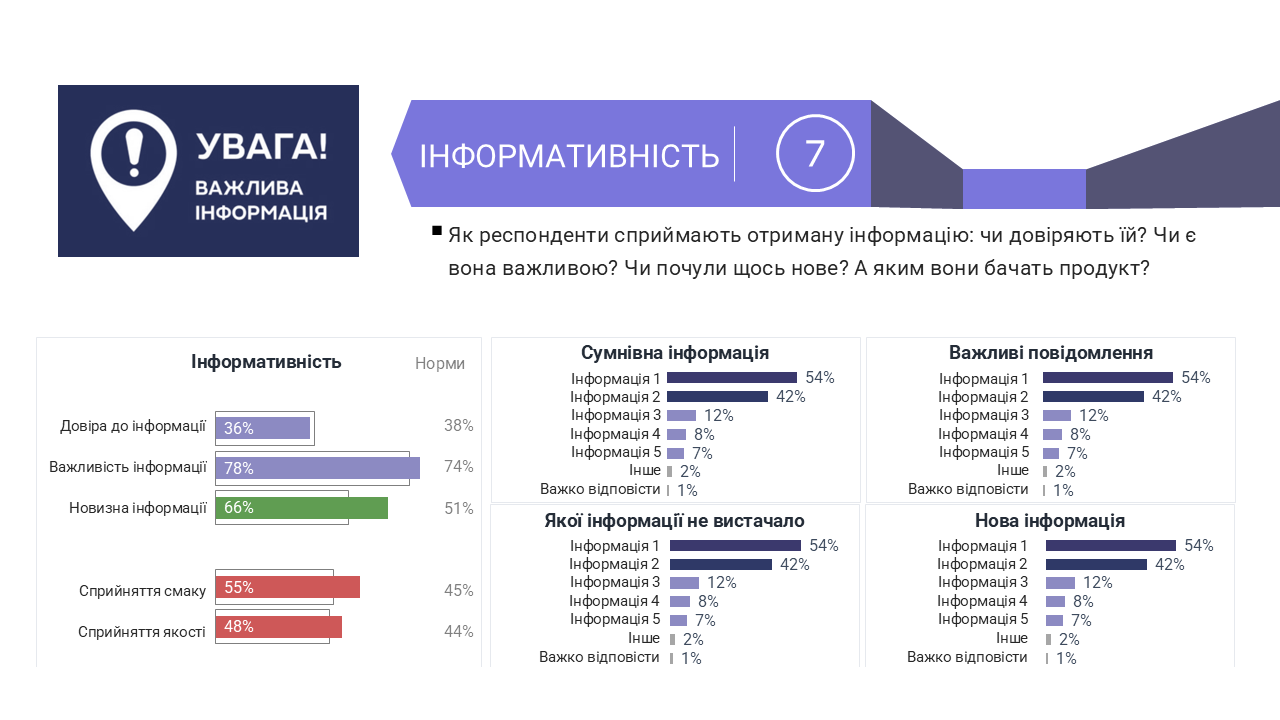
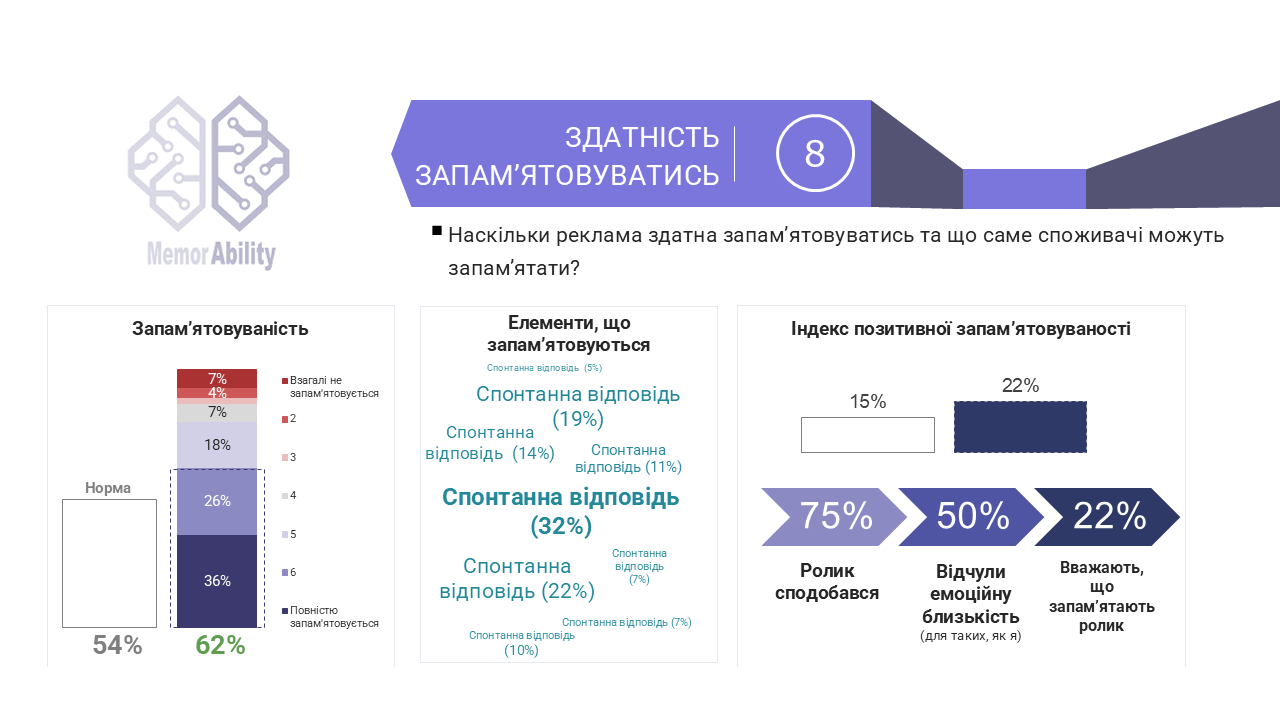
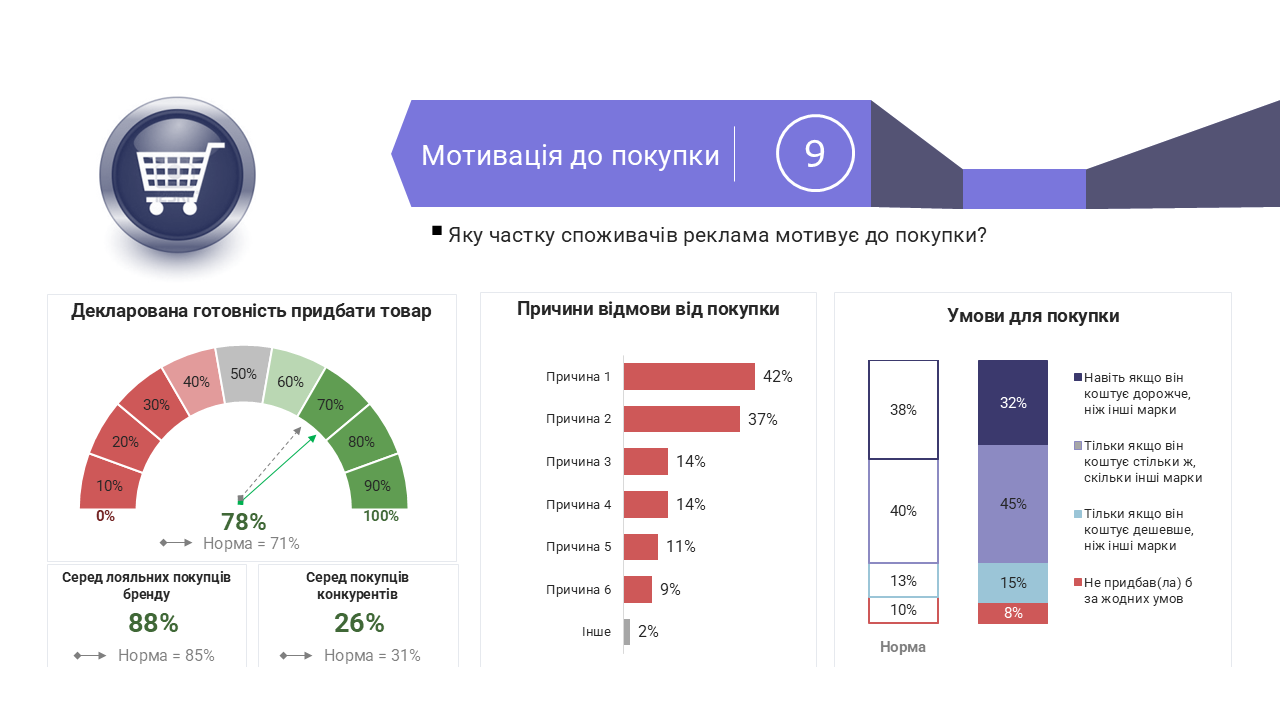
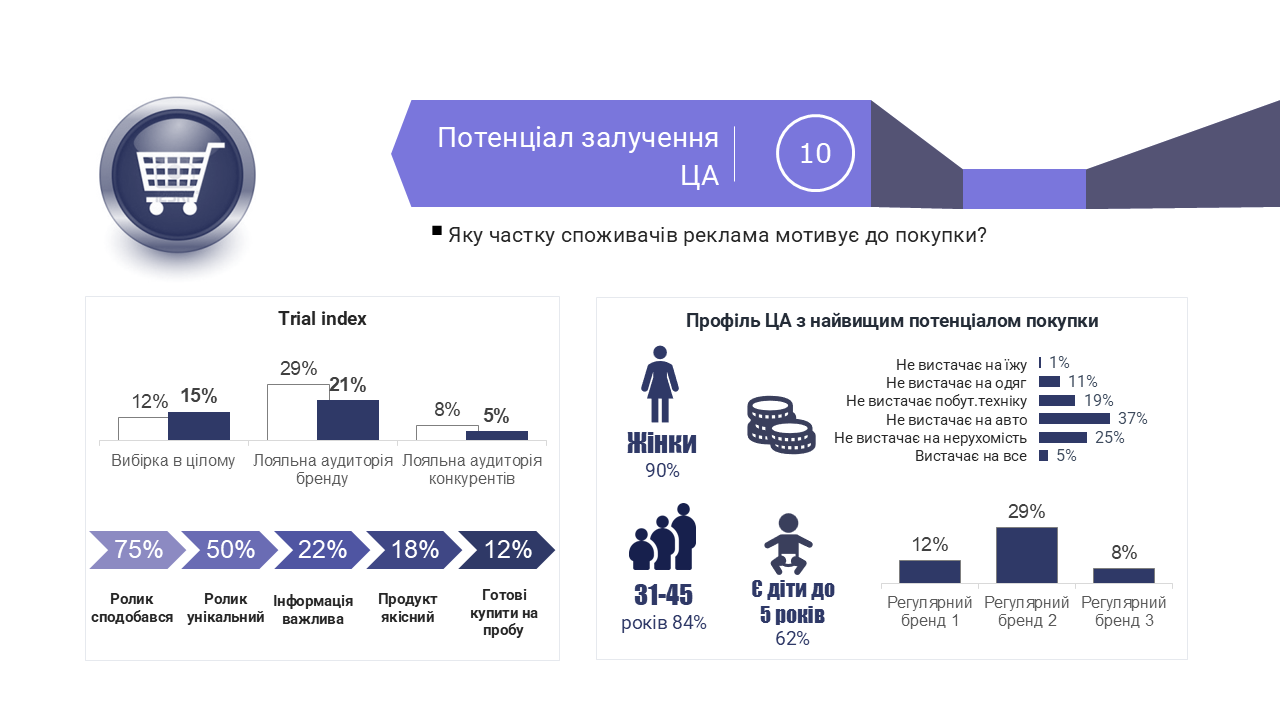
Below are real report spreads. The figures and brand names in the examples have been changed; the structure of the pages and the set of metrics match what you will receive.
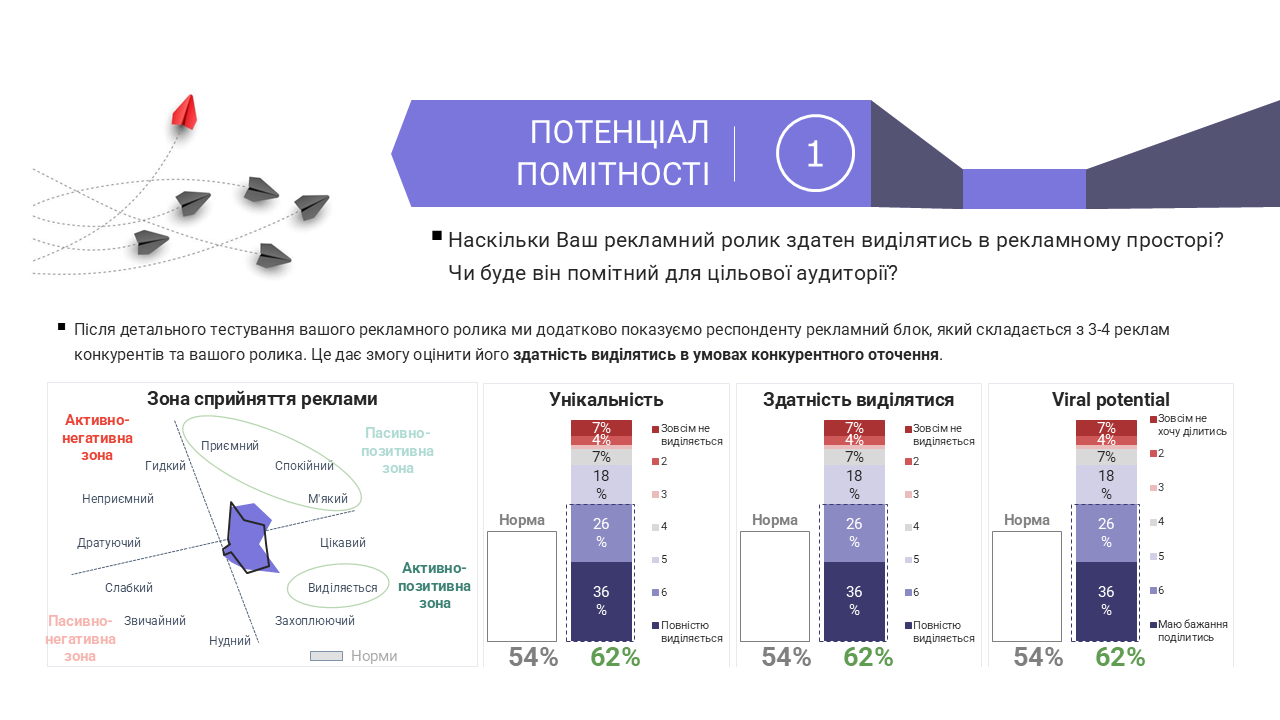
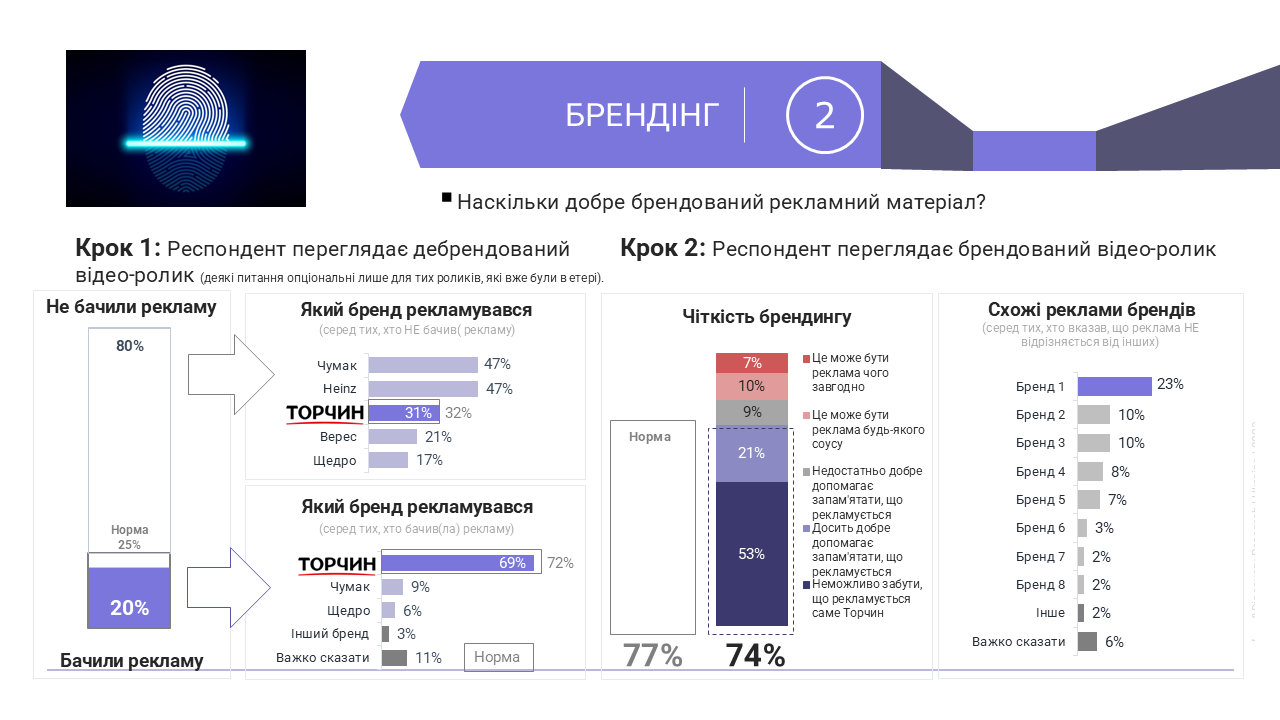
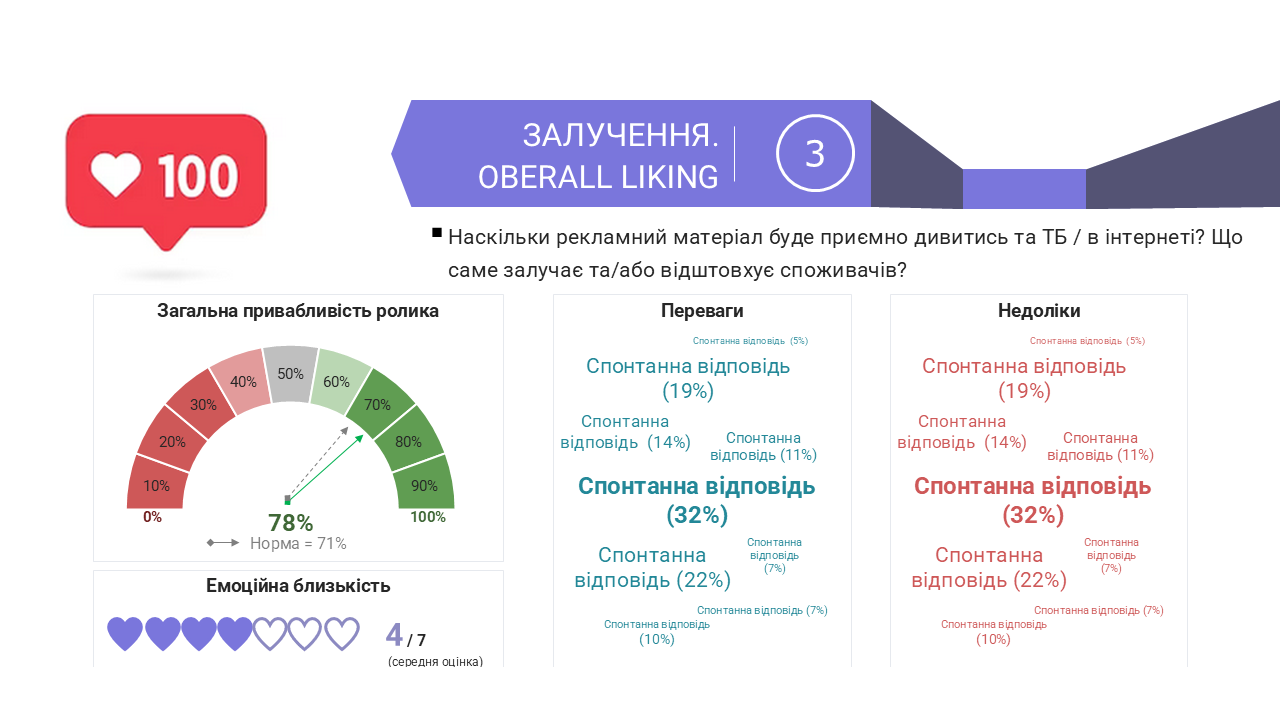
Norms: what your video is compared with
An absolute figure means nothing on its own. Is 62% appeal good or bad? The answer depends on how the other videos in your category look.
Norms are calculated as the average across all the advertising videos our company has tested before. We keep them separately by type of material and separately by product category, so an animatic is compared with animatics and pet food with pet food.
- By type of material. Separate norms for the finished video product and separate ones for an animatic, so that decisions at the pre-production stage are taken on a correct basis.
- By product category. Comparison within your own category shows whether the ad works better or worse than the competitive environment, rather than than the market as a whole.
- The base keeps growing. Every test we run refines the norms. Over time they become more accurate specifically for the Ukrainian market and the wartime context.
Parameters and cost
We publish the price because we believe that at the stage of choosing a contractor it should be known straight away, not after three phone calls.
CAWI
An online survey: the respondent fills in the questionnaire on their own, without an interviewer, at a convenient time and on their own device.
From 100 respondents
Per advertising video. The questionnaire takes about 15 minutes. Respondents are drawn from our own Discovery online panel.
Ukraine, 50K+
Cities with a population of 50,000 and above, excluding temporarily occupied settlements.
From 5 working days
Testing one video: questionnaire preparation, programming, data collection and the tabulated report.
+2 working days
The analytical report for one video. Three days for two videos, four days for three.
from UAH 40,000
For detailed testing of one advertising video in the basic configuration.
What affects the final price. The base cost is calculated for product categories with a penetration of at least 70%. If the target audience is narrower, more screenings are needed per eligible respondent, so the cost goes up. It is also affected by the number of videos in the project, the sample size, the length of the questionnaire and the scope of the analytics. The final cost is calculated individually after the brief.
When AdNavigator is the right choice for ad testing
There are three different approaches to pre-testing on the market, and they solve different tasks. Here is an honest account of when our tool is the right fit and when it is not.
AI forecast without respondents
The model breaks the video down into frames and predicts effectiveness from a historical base. Results in minutes, minimal cost.
AdNavigator
Consumers from your category, ten diagnostic modules, second-by-second and word-by-word detail, norms by category.
A quick screening on 2–3 questions
A few like/dislike ratings on a small sample. Cheap and within a day.
How the project runs
From brief to report: six steps. Access to the data opens not at the end but as soon as the field starts. The methodology, the questionnaire, quality control and the analytical conclusions are handled by the Discovery Research team, which specialises in studies of communication effectiveness and consumer behaviour.
Brief
We receive the video, a description of the target audience and the key message you built in. It is against that MTO that whatever the audience actually read will later be checked.
Questionnaire and competitive block
We adapt the questionnaire to the category, select 3–4 competitor videos for the cut-through block and prepare a de-branded version of your video.
Programming on the platform
The questionnaire is built on our own Discovery survey platform, including the second-by-second slider and the text mark-up, which standard survey builders do not offer.
Fieldwork on our own panel
Launch on the Discovery online panel with the quotas observed. Collection statuses are visible in real time. You see the sample filling up instead of waiting for a final file.
Learn more about the panelTabulated report
The full dataset with breakdowns by subgroup. This stage is included in the basic 5 working days.
Analytical report with norms
Every metric compared against the category norm, conclusions for each of the ten modules and specific recommendations on how to refine the video.
Frequently asked questions
What is a pre-test of an advertising video?+
A pre-test of an advertising video is a quantitative study of the target audience’s reaction before the campaign is launched. It shows whether the ad is noticeable, whether the brand and the message are read correctly, which moments of the video work or lose attention, and whether the video motivates purchase.
What does the client receive after the advertising effectiveness test?+
The client receives a tabulated report, an analytical report with a comparison against the category norms, conclusions for ten modules and applied recommendations: what to keep, what to change in the visuals, the text and the branding, and whether the video is ready for media placement.
How many advertising videos can be tested in one study?+
From one to several. The timeline grows gradually: preparing the analytical report takes 2 working days for one video, 3 days for two videos and 4 days for three. The fieldwork is carried out in parallel, so testing several videos as one project is more cost-effective than as separate ones.
Can an animatic be tested instead of a finished video?+
Yes. We keep separate norms for the finished video product and separate ones for animatics, so the results of an animatic are compared with animatics rather than with final videos. That makes it possible to take decisions before spending on full production.
Where do the norms for comparison come from?+
The norms show the average values across all the advertising videos our company has tested before. They are kept separately by type of material and separately by product category: medicines, alcoholic drinks, confectionery, pet food and others. That answers the question of whether your video performs better or worse than other videos in its category.
How long does the study take?+
From 5 working days for one video. That period covers questionnaire preparation, programming, data collection and the tabulated report. The analytical report is prepared in addition: 2 working days for one video.
What is the geography and the sample of the study?+
Ukraine, cities with a population of 50,000 and above, excluding temporarily occupied settlements. The basic sample: from 100 respondents per video, with a questionnaire of about 15 minutes. Respondents are drawn from the Discovery proprietary online panel.
Can we see the questionnaire before the project starts?+
Yes. A demo version of the questionnaire is available online. You can go through it yourself and see all the question types, including the second-by-second slider and the text mark-up. Open the demo questionnaire →
What does the final cost depend on?+
The cost starts from UAH 40,000 for product categories with a penetration of at least 70%. The final cost is affected by how narrow the target audience is, the number of videos, the sample size, the length of the questionnaire and the scope of the analytics. We calculate the exact amount after the brief.
Does the respondent see competitors’ advertising?+
Yes, in the cut-through potential module. After the detailed testing of your video, the respondent is additionally shown an ad break of 3–4 competitor videos together with yours. That makes it possible to assess the ability to stand out specifically in a competitive environment rather than in isolation.
Send us the video. We will tell you whether it is worth launching
All we need is the file, a description of the target audience and the key message you built in. We come back with a quote and a timeline after a short clarification of the details.